Business Process Improvement
Anne Curtis
Business Process Improvement
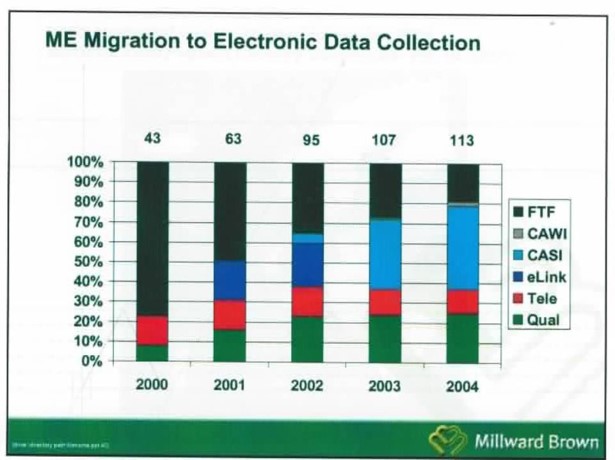
Graphical Illustration of restructuring via business process improvement and impact to new technologies and financial improvement
Explanation of Graph:
Data Collection Definitions:
Data Collection Definitions:
- Qual – Qualitative, consisting of Focus Groups and One-to-One Interview methods primarily used upfront to develop concepts
- Tele – Telephone interviews via CATI – CATI Centers were in all counties FTF – Face-to-Face – Manual Door-to-Door Data Collection (all piece workers and part of Direct Costs)
- eLink – the first step to converting FTF to Electronic, piloted on the “Link” Product to validate the migration would not impact the normative data
- CASI – Once validated, migrated to Web-based, a very early generation of today’s Cloud, before it was called Cloud, done in Venues across Europe
- CAWI – Beginning of the Web Interviews, which are very prominent today for Market Research and Customer Satisfaction
Evolution
Approached largest client to partner in the Pilots, conducted parallel environments, whereby the client was guaranteed 10% savings. After validation and implementation, 25% savings in Direct Costs were achieved, thus the correlation to “A Picture Paints 1,000 Words” (Profit increase due to implementation of Technology as well as integration into a Pan-European Operating Model).”